RadixSort Visualization
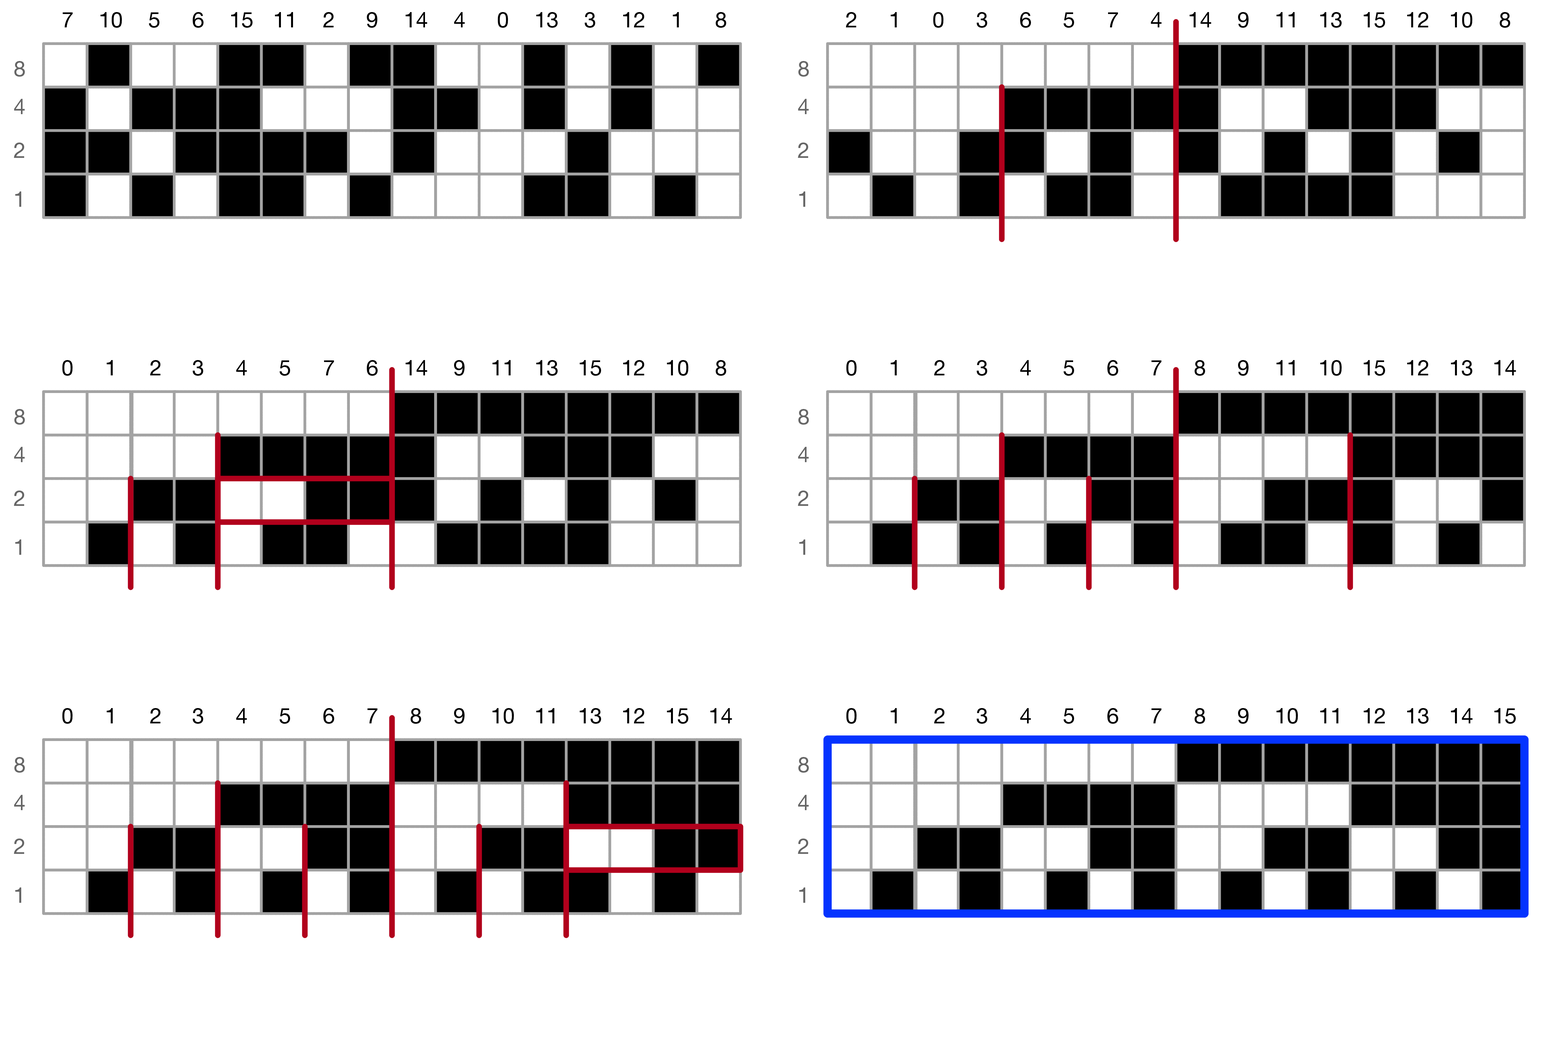
Here is a visualization of the “outside in” procedure for sorting binary values. In this visualization, as well as the following RadixSort visualization, white boxes indicate 0 values and black boxes indicate 1s.

Here is an illustration of RadixSort on an array consisting of the values 0 through 15. Each value is represented by a column of boxes (bits), where the top row is most significant bits (the 8s bit), and the bottom row is least significant (1s bit). In each step, the values containing the highlighted bits are sorted using the binary sort subroutine depicted above.
